Lab setup
Lab overview
In this lab, we're building a simple network monitoring setup using Splunk Enterprise, Splunk Universal Forwarder, and Sysmon. The goal is to collect and analyze Windows event logs, including detailed system activity via Sysmon, using Splunk on a centralized Ubuntu server.
Lab topology
| Role | OS | IP Address | Description |
|---|---|---|---|
| Server | Ubuntu Server | 192.168.200.3/24 | Splunk Enterprise Server |
| Victim/User | Windows | 192.168.200.4/24 | Splunk Universal Forwarder |
| Attacker | Kali Linux | 192.168.200.5/24 | C2 Server (Simulated Attacker) |
Installing Splunk Enterprise on Ubuntu Server
- Download the .deb package here.
- Install Splunk:
sudo apt install ./<splunk-package>.deb
- Start Splunk and accept the license:
sudo /opt/splunk/bin/splunk start --accept-license
- Set up the admin account and login at
http://192.168.200.3:8000. - Create 3 indexes:
- Navigate to
Settings>Indexes>New Index - Create the following indexes:
sysmon_logs,security_events,windows_system_logs
- Navigate to
Installing Splunk Universal Forwarder on Windows
- Download the installer here
- Install and create an admin account.
- Configure the forwarder to connect with Splunk Enterprise:
- Open cmd as Administrator and run:
cd "C:\Program Files\SplunkUniversalForwarder\bin"
splunk enable boot-start
splunk start
splunk add forward-server 192.168.200.3:9997 -auth username:password
- Add event log monitors:
splunk add monitor "C:\Windows\System32\winevt\Logs\Security.evtx"
splunk add monitor "C:\Windows\System32\winevt\Logs\Application.evtx"
splunk add monitor "C:\Windows\System32\winevt\Logs\System.evtx"
splunk add monitor "C:\Windows\System32\winevt\Logs\Microsoft-Windows-Sysmon%4Operational.evtx"
splunk restart
- Configure inputs.conf:
- Navigate to
C:\Program Files\SplunkUniversalForwarder\etc\system\local - Create or edit
inputs.confwith the following content:
- Navigate to
[WinEventLog://Security]
disabled = false
index = security_events
sourcetype = WinEventLog:Security

[WinEventLog://Application]
disabled = false
index = windows_system_logs
sourcetype = WinEventLog:Application

[WinEventLog://System]
disabled = false
index = windows_system_logs
sourcetype = WinEventLog:System

[WinEventLog://Microsoft-Windows-Sysmon/Operational]
disabled = false
renderXml = true
index = sysmon_logs
source = XmlWinEventLog:Microsoft-Windows-Sysmon/Operational
- Restart the forwarder
splunk restart
- Verify Splunk Forwarder Service Account:
Get-WmiObject win32_service | Where-Object { $_.Name -eq "SplunkForwarder" } | Select-Object StartName
- If not running as LocalSystem:
- Open
services.msc - Locate SplunkForwarder
- Right-click → Properties → Log On tab
- Select Local System account
- Restart the service
- Open
- Enable Receiving on Splunk Enterprise:
- Go to
Settings>Forwarding and Receiving>Configure Receiving - Add port 9997
- Go to
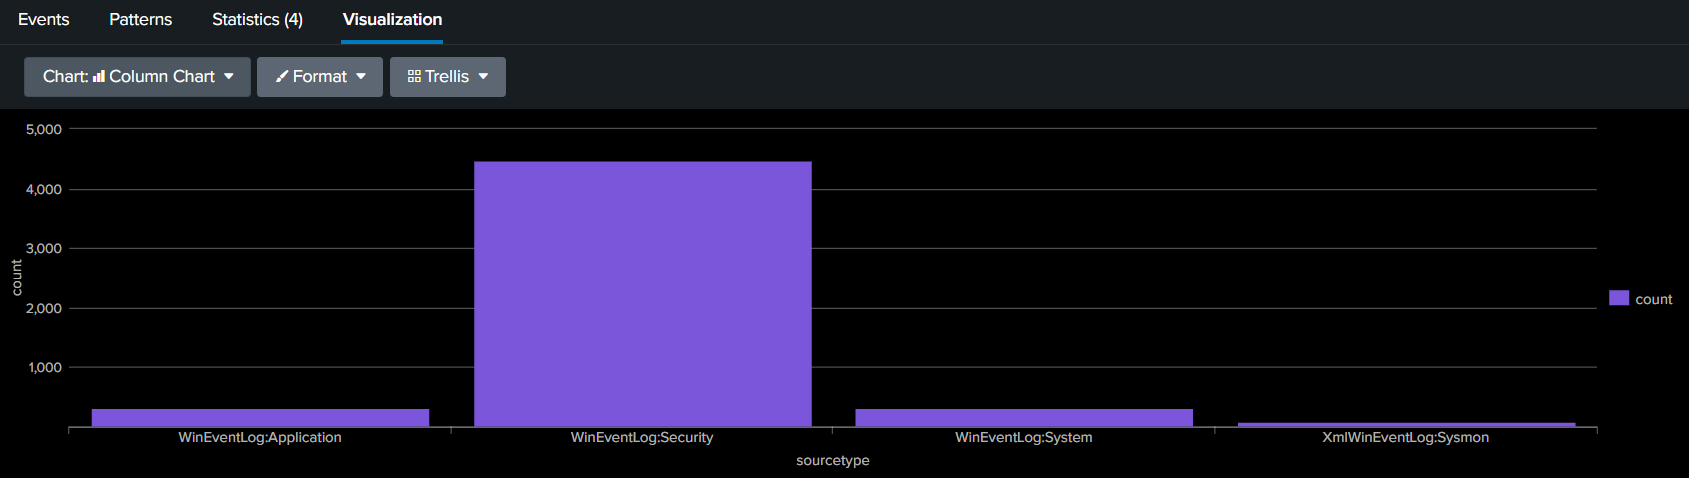
- Go to Search & Reporting dashboard and run:
index="*" | stats count by sourcetype
This verifies data is being received.
Installing Sysmon on Windows
- Download Sysmon.
- Get a configuration file at SwiftOnSecurity Sysmon Config.
- Install Sysmon with config:
sysmon.exe -i sysmonconfig-export.xml
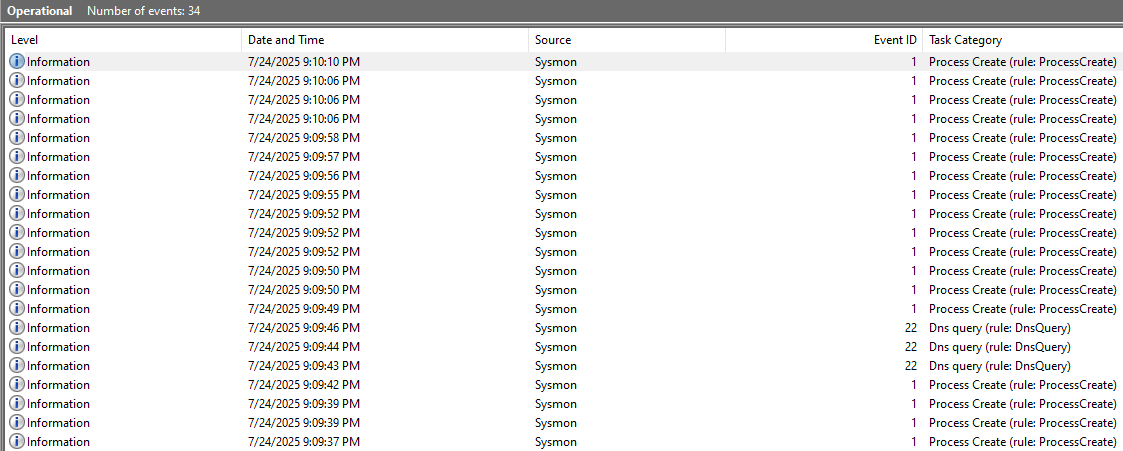
- Verify logs:
- Open Event Viewer
- Navigate to
Applications and Services Logs>Microsoft>Windows>Sysmon>Operational - Ensure logs are being generated and Sysmon is running properly.
With this setup, you're now collecting and forwarding critical Windows logs and Sysmon data to a centralized Splunk instance. This foundation can be expanded into more complex threat detection and monitoring use cases in future labs.